Troubleshooting Citrix Session Poor Response / High Latency
I was recently tasked with troubleshooting very poor performance on a Citrix Presentation Server 4.5 Advanced Edition Farm.
Hardware Requirements
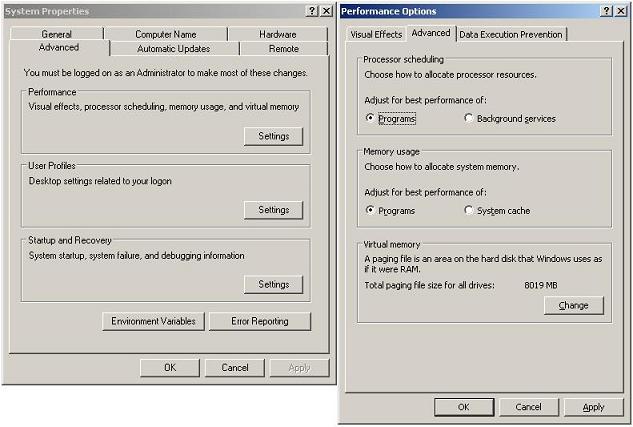
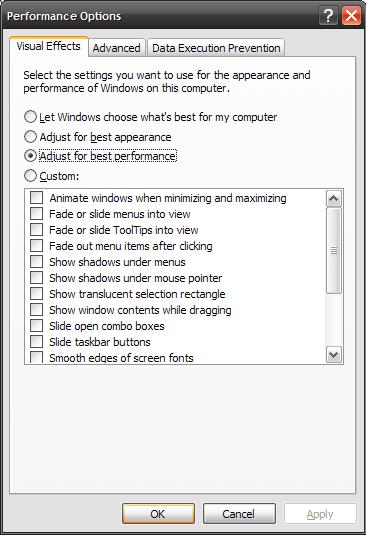
Your first port of call should be server specification: is the server ‘man’ enough for the task being asked of it? Use the built-in Windows Performance Counters to troubleshoot here.
Check you CPU usage and troubleshoot specific processes if your CPU utilisation is very high. For my environment CPU usage was at < 5%; this was not the governing performance issue.
Memory utilisation can also hinder performance. As a Citrix server runs out of RAM the number of pages /second dramatically increase. Memory usage was circa 50% and the number of pages /second was low.
Network utilisation; whilst ICA is a low-bandwidth application other applications on your environment may be increasing network latency due to saturation of the network link. Use the built-in Windows Performance counters and your switch management tools to ascertain if this is your governing issue. For my environment network usage was < 5% on a 100MB Full-Duplex link.
Network Problems
Are there specific problems with your network that are causing peaks in latency and dropped packets?
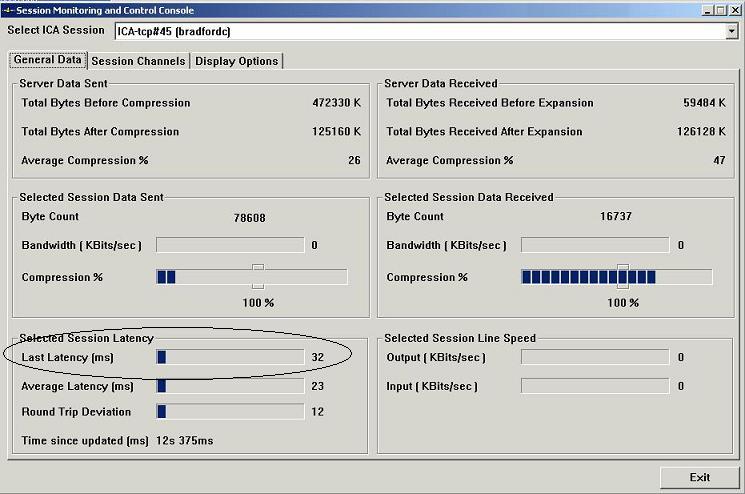
Using the Metaframe Servers SDK (MFCOMSDK) v2.3 tool; smcconsole.exe I was able to monitor individual user sessions.

Using this tool you can view individual sessions bandwidth utilisation and latency. This tool is incredibly useful when troubleshooting issues regarding session performance. Session latency can also be viewed using the WMI performance counters for ICA Session that are installed when Citrix is installed on a Windows Server.
The Metaframe Server SDK version 2.3 is available from here
The image above shows a latency figure of 32ms. This equates to 0.03 seconds – a more than acceptable latency figure for an ICA session. When troubleshooting my issues I was receiving figures of 27000ms (yes, 27 seconds!).
Common causes of high latency are:
Ø Network topology issues including port mismatches
Ø MTU issues
Ø Link saturation / QoS
A quick and easy check, which should identify any serious network issues, is to conduct what I call a ‘loaded ICMP echo request’ from a network that is experiencing the latency issues to a server in the Citrix farm. A normal ICMP echo request is 32 bytes; we are able to load the packet with up to 1500 bytes. This is achieved using the following command:
> ping ctxserver1 –t –l 1472 -f
Let me explain the command. The ‘-t’ option forces the ping to repeat until instructed otherwise (i.e. cancelled with Ctrl-C). The ‘-l 1472’ option sets a packet length of 1472 bytes; there is a 28byte packet overhead therefore, the total packet size is 1500.Finally, the ‘-f’ option forces the packet to not fragment over multiple packets.
First, verify that the MTU for your network is in fact 1500 bytes. You can verify this by using the same test to other servers and devices across your network. If you see many dropped packets you know there is a network fault, which may well be the cause of your performance woes.
Using this test I identified that there was a fault. The next step is to identify where this fault is occurring.
Use ‘tracert’ to identify the path that your packets travel in order to reach your citrix server. Then perform this loaded ping test to each of these addresses one at a time.

 Const HKEY_CLASSES_ROOT = &H80000000