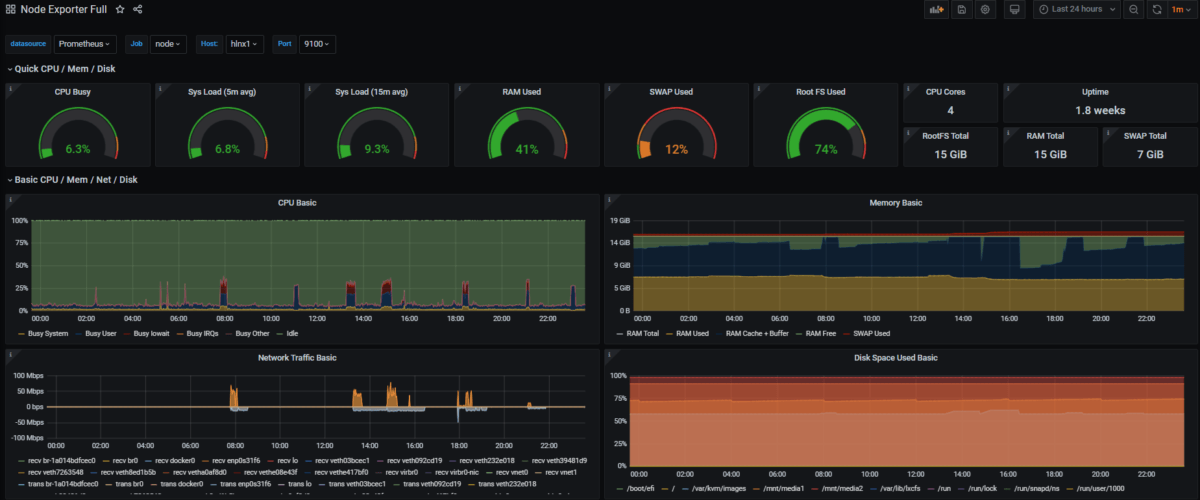
I recently set out to get Prometheus setup, capturing metrics across ‘traditional’ VM (Ubuntu 18.04) and containerised workloads whilst enabling visibility of captured metrics in Grafana. The steps captured below outlines the approach/ configuration I used to get Prometheus, Node-Exporter and cAdvsor up and running. I’ll follow-up with the Grafan Integration/ Configuration in a separate post.
Note this guide assumes you have Docker CE running on the machine you intend to deploy and run Prometheus.
First, create the required user accounts:
sudo useradd -rs /bin/false prometheus
sudo useradd -rs /bin/false node_exporter
Make a note of the ‘prometheus’ account user and group id’s from /etc/passwd, you’ll need these later:
cat /etc/passwd | grep prometheusCreate the required directory structure, in order to ensure configuration and metric data persists container redeployment:
mkdir -p ~/prometheus/config
mkdir -p ~/prometheus/data
Create Prometheus configuration file:
sudo vi ~/prometheus/config/prometheus.ymlContents (note that ‘localhost’ is used for targets):
# A scrape configuration scraping a Node Exporter and the Prometheus server
# itself.
global:
  scrape_interval:     15s # By default, scrape targets every 15 seconds.

scrape_configs:
  # Scrape Prometheus itself every 5 seconds.
  - job_name: 'prometheus'
    scrape_interval: 5s
    static_configs:
      - targets:
        - 'localhost:9090'

  - job_name: 'node'
    scrape_interval: 5s
    static_configs:
      - targets:
        - 'localhost:9100'

  - job_name: 'cadvisor'
    scrape_interval: 5s
    static_configs:
      - targets:
        - 'localhost:9080'
Set required filesystem permissions:
sudo chown -R prometheus:prometheus ~/prometheus/Create docker-compose.yaml:
vi ~/prometheus/docker-compose.yamlContents as below, remember to set the correct user id and group id for the ‘prometheus’ user , as captured earlier:
version: '3.2'
services:

  prometheus:
    user: 999:998
    image: prom/prometheus:latest
    container_name: prometheus
    logging:
      options:
        max-size: "10m"
        max-file: "5"
    restart: unless-stopped
    ports:
    - 9090:9090
    command:
    - --config.file=/etc/prometheus/prometheus.yml
    - --storage.tsdb.path="/data/prometheus"
    volumes:
    - ./config/prometheus.yml:/etc/prometheus/prometheus.yml:ro
    - ./data:/data/prometheus:rw
    depends_on:
    - cadvisor

  cadvisor:
    image: google/cadvisor:latest
    container_name: cadvisor
    logging:
      options:
        max-size: "10m"
        max-file: "5"
    restart: unless-stopped
    ports:
    - 8080:8080
    volumes:
    - /:/rootfs:ro
    - /var/run:/var/run:rw
    - /sys:/sys:ro
    - /var/lib/docker/:/var/lib/docker:ro
    depends_on:
    - redis

  redis:
    image: redis:latest
    container_name: redis
    logging:
      options:
        max-size: "10m"
        max-file: "5"
    restart: unless-stopped
    ports:
    - 6379:6379
I ran into issues with the containerised version of node-exporter, where instances in Grafana would persistently show ‘N/A’ or no-data, despite metrics being captured as expected in Prometheus itself.
Moving to a ‘natively’ installed node-exporter fixed these issues.
Download and extract the latest version of node-exporter, this is an X66_64 example:
cd ~

wget https://github.com/prometheus/node_exporter/releases/download/v1.0.0/node_exporter-1.0.0.linux-amd64.tar.gz

tar -xvf node_exporter-1.0.0.linux-amd64.tar.gz
cd node_exporter-1.0.0.linux-amd64
Copy the node-exporter binary to /usr/sbin:
sudo mv node_exporter /usr/sbin/Create systemd service:
sudo touch /etc/systemd/system/node_exporter.service

sudo tee -a /etc/systemd/system/node_exporter.service > /dev/null <<EOT
Description=Node Exporter

[Service]
User=node_exporter
EnvironmentFile=/etc/sysconfig/node_exporter
ExecStart=/usr/sbin/node_exporter $OPTIONS

[Install]
WantedBy=multi-user.target
EOT

sudo mkdir -p /etc/sysconfig
sudo touch /etc/sysconfig/node_exporter

sudo tee -a /etc/sysconfig/node_exporter > /dev/null <<EOT
OPTIONS="--collector.textfile.directory /var/lib/node_exporter/textfile_collector"
EOT
Create required folder structure for node-exporter, note the use of the ‘node_exporter’ account we created earlier:
sudo mkdir -p /var/lib/node_exporter/textfile_collector
sudo chown node_exporter:node_exporter /var/lib/node_exporter/textfile_collector
Reload systemd daemons and start node-exporter:
sudo systemctl daemon-reload

sudo systemctl enable node_exporter

sudo systemctl start node_exporter
You should now be able to view node-exporter metrics via: https://localhost:9100
Now, we can start Prometheus and cAdvisor, as defined in our Docker Compose file:
cd ~/prometheus
sudo docker-compose up -d
You should now be able to browse Promethus itself via: http://localhost:9090
Browse to http://localhost:9090/targets and ensure that cAdvisor, Node and Prometheus show as ‘1/1 up’ – assuming that they do, you have a working Promethus installation.
Adding new nodes to Node-Exporter is as simple as deploying Node-Exporter as above, on each required ‘target’ or node you wise to monitor, then editing the prometheus.yml file to include the new ‘target’ – for example:
...

  - job_name: 'node'
    scrape_interval: 5s
    static_configs:
      - targets:
        - 'localhost:9100'
        - 'newserver:9100'

...
Add additional targets to the ‘node’ job (rather than creating new jobs for each host) as this will make viewing the data in Grafana easier.
Once you have updated and saved the configuration file, restart Prometheus:
cd ~/prometheus
sudo docker-compose restart