You’re probably wondering why do I want to use a hacked firmware with my thermostat? The primary use case is offline/ non eWelink/ cloud connected usage, as-in leveraging the smart capabilities of the thermostat without having to leverage the cloud to drive it. This also enables you to choose the home automation platform that you use ther thermostat with, for example you can use Home Assistant.
Where to Buy
You can purchase these devices on eBay, AliExpress, Bangood and other auction sites, I’ve also seen them available at some US retailers. These units typically sell for anything between 20-30 Pounds, or about 40 USD at time of writing. With a little time invested you can great ‘big-brand’-like capabilities for a comparatively small outlay.
Look out for:
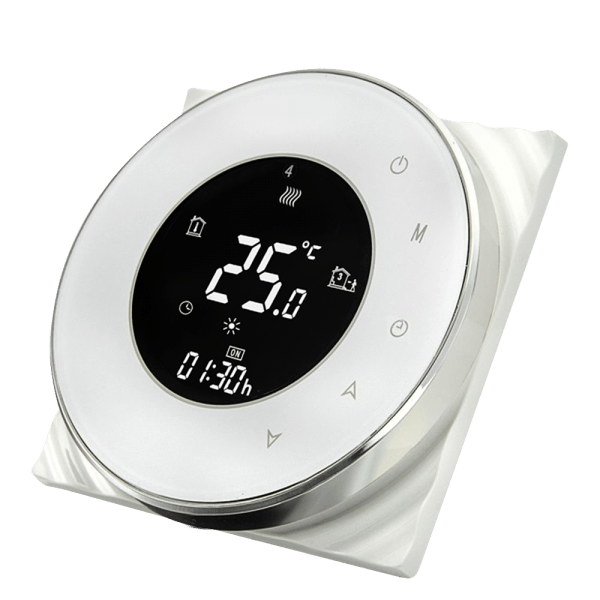
- Beca BHT1000, BHT3000, BHT6000 (ensure you get a ‘W’ model that has Wi-Fi support!). These are also re-badged as THP-1000, THP-3000, THP-6000.
- Moes House
It’s worth noting that you’ll need both a live and neutral connection to power your thermostat. Unfortunately if you don’t have a neutral you won’t be able to use these devices.
Kit List
To hack your Wi-Fi thermostat you’re going to need:
- A Raspberry Pi 3/4 (this just makes the process easy as you need both Wifi and Ethernet connectivity), running Raspberry Pi OS
- An RJ45 patch cable, connecting your Rasperry Pi to an Internet connection
- A Tuya-based thermostat
We’ll be using the awesome firmware created by Klaus Ahrenberg, well actually a fork of it created by Folke Ashberg, links to the associated repositories are in the description below. In case you’re wondering, the drivers for using Folke’s fork is that there is support for custom NTP configuration and Home Assistant automatic discovery.
Disclaimer

At this stage I should probably remind you that flashing modified firmware to your device will void any remaining warranty. I’ll also add that any wiring should be completed by a competent and qualified electrician (note these two can be mutually exclusive), you potentially risk your life and /or your home, and that’s on you, not me.
Flashing Time
So with the disclaimer out of the way let’s get hacking… actually you can put the soldering iron away, unless you’re a gluten for punishment and then follow the link and stop watching this video! The simplest way to hack your thermostat is to use Tuya Covert, you’ll also find a link to this in the description below.
We’re going to run Tuya Convert on the Raspberry Pi, that by now you hopefully have setup running Raspberry Pi OS. In all honesty any laptop, or other Linux distribution, within reason, will likely work without issue.

Prepare Thermostat
First you need to get the Thermostat into flashing mode, you can do this by powering off the device using the front panel, then holding the ‘down arrow’ for approx. 10 seconds. You’ll know it’s working when the screen / wifi-symbol starts flashing – the Thermostat is now ready/ waiting for instructions.
Install Tuya Convert
Next we’ll move on to installing Tuya Convert on the Raspberry Pi. You’ll find the commands I use in this part of the video in the description below.
We download the latest Tuya-Convert source files using git.
git clone https://github.com/ct-Open-Source/tuya-convert
Next we download the hacked firmware image, ready for flashing to the Thermostat.
cd tuya-convert/files
wget https://github.com/fashberg/WThermostatBeca/releases/download/v1.16.beta5-fas/wthermostat-1.16.beta5-fas.bin
cd ..
Now we install the pre-requisites for Tuya Covert to run.
./install_prereq.sh
Flash the Device
Now, finally(!), we can flash the hacked firmware to the Thermostat itself. Kick-off the flashing process by executing the start_flash.sh script.
./start_flash.sh
When prompted, press Enter to proceed with the flashing process.
It make take a minute or so to progress beyond the Smart Config stage, so just be patient.
Once the Smart Config stage has completed, Tuya Convert will backup the existing firmware, just wait it out, you may be greatful for this back-up in future.
Now the backup has completed we’re presented with firmware images to flash to the Thermostat. Enter the number associated with the image downloaded earlier, for me it was simply a case of entering #3 and pressing enter.
So you’re finally here… the point of no return (well, not quite, but you’ll potentially be soldering). Hit ‘Y’ to continue with the firmware flash, then wait for it to finish.
When the flashing process has completed, you’ll be asked if you want to flash another device… only you know the answer to that question. I did not, so entered ‘N’ and Tuya-Convert cleaned itself up and closed.
Configure the Thermostat
At this point there should be a new Thermostat SSID being broadcast, if not power off the Thermostat as before, hold down the ‘down arrow’ and wait for the backlight/ wifi icon to start flashing.
Using a mobile phone, or other wireless device, connect to this new wireless network, using the password ‘12345678’ – if using an Android device you should be prompted to ‘sign-in’ to the network which will then present the configuration page for the Thermostat.
Hit the ‘Configure Network’ button and then enter your wireless SSID and password.
Enter your wireless network SSID and password. At this stage I’d also suggest disabling MQTT Support, we’ll come to that once we have the device connected to your network. Hit ‘Save Configuration’ and the device will restart, hopefully connecting to your specified network.
You’ll need to identify the IP Address that is provided to the Thermostat as it joins your network. How to do this varies (significantly) by network, so I’ll leave you to figure that out before proceeding.
Once you have the IP address for the device, open a browser on any device connected to the same network, and browse to http://.
Now you’re back to the configuration page return to the ‘Configure Network’ page and enable MQTT support and complete the server/ credentials configuration to match your environment. At this point you can also choose to enable support for Home Assistant Autodiscovery.
Note that if you are using an ACL file on your MQTT server you’ll need to configure this appropraitely.
Hit ‘Save Configuration’ to again restart the Thermostat.
You’re done, and now can integrate the thermostat into your Smart Home platform such as Node-RED (be sure to check out the Alexa and Google Home integration for Node-RED), Home Assistant, OpenHAB etc.
]]>I’ll start by saying that I’m a huge advocate for the Wi-Fi Smart Home. Wireless is ubiquitous and thus the barriers to entry are low. For a good proportion of automation scenarios it is simply “good enough.”

Why Zigbee?
So you’re probably wondering where Zigbee fits then… well for me Zigbee offers flexibility. I’m able to place Zigbee sensors (for example motion sensors or contact sensors) where I have no means to power them, and where Wi-Fi would drain batteries in days or a few weeks at a push (Wi-Fi simply needs more power than Zigbee does).

It’s not about Wi-Fi VS. Zigbee, Wi-Fi OR Zigbee, it’s about Wi-Fi AND ZigBee, and that is where the Sonoff Zigbee bridge comes in.
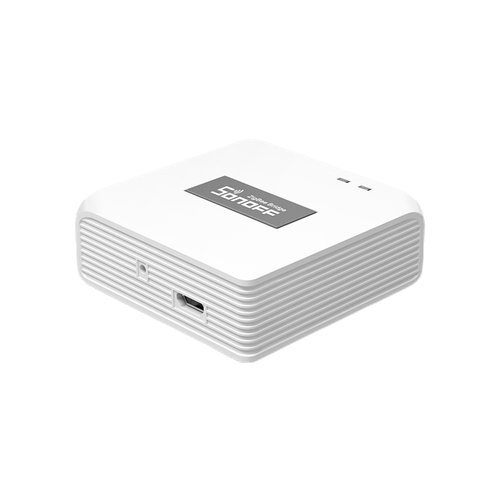
Sonoff Zigbee Bridge
You can pickup a Sonoff Zigbee Bridge for around £10-£15, or $15-$20 at time of writing. eBay, Aliexpress, Bangood all have the device available. ZigBee sensors are also good value, I was able to find Zigbee motion sensors for £6/ $8 and contact sensors for similar money, so in reality you can get up and running without breaking the bank.

The Sonoff Zigbee Bridge connects to your Wi-Fi and enables you to control Sonoff and other vendors’ Zigbee devices with the eWeLink App and Cloud, alongside other Sonoff/ eWelink compatible Wi-Fi devices. You can also use Zigbee devices to trigger/ interact with your Wi-Fi devices – so the possibilities here are really interesting.
Why Tasmota?
The next big question is ‘why Tasmota?’ Reducing complexity in systems makes them easier to maintain in the long-run.

Complex systems, comprised of many different components and the software or services required to support become harder and hader to maintain as they grow. The greater the variation, the greater the complexity.
I use Tasmota across virtually all of the Wi-Fi equipment in my smart home. This means that I’m able to have one update process, and primarily need to know the ins and outs of one solution, instead of several to keep my smart home running.
Flashing Tasmota
Flashing the Zigbee Bridge is pretty simple, thanks to the Open Source Communities behind Tasmota, Tasmotizer and Zigbee2Tasmota.
- First, pull away the rubber feet on the rear of the bridge, revealing the four screws. Remove the screws to open the bridge, then gently free the PCB.
- Turn the PCB over and identify the location of the ETX, ERX, IO0, GND and 3v3 connection points. You can push breadboard cables through the connection points, meaning this is a solder-free flashing process. Note that dupont cables will not fit.
- When ready, connect the FTDI adapter to you PC/ laptop, ready to flash Tasmota.
- Next. download the specific Zigbee Bridge Tasmota binary and flash with Tasmotizer.
| ZbBridge | FTDI Adapter |
| ETX | RX |
| ERX | TX |
| IO0 | GND |
| GND | GND |
| 3V3 | 3V3 |
- Once completed the bridge will restart and a new Tasmota Wi-Fi network will available. Connect to this network using your phone and configure the bridge with your Wi-Fi network SSID and password.
Before proceeding you’ll need to identify the IP address of the Zigbee bridge, likely provided by your router. Once identified, on a device connected to the same network open a browser session and browse to the IP address of the Zigbee bridge.
Flashing the Zigbee Module
At this pont you’d normally be done if this was a traditional Wi-Fi-only module, however we now have to flash the Zigbee module within the bridge.
- Download the Zigbee module firmware and then use the Tasmota GUI to flash this to the Zigbee module.
Tasmota Configuration
You’re now set to configure the device as you would any other Tasmota Wi-Fi device – at the very least set the MQTT server/ credential configuration, friendly name and MQTT topic for your environment.
Zigbee Device Pairing
To pair Zigbee devices, you need set the bridge into pairing mode using the ‘ZbPermitJoin 1‘ Tasmota console command. This will allow pairing for 60 seconds.
Now, on a device such as the Sonoff Zigbee Motion sensor, press and hold the pairing button, then watch the cosole for more pairing confirmation.
And with that we’re done. The bridge is ready, and your Zigbee sensors or devices are paired. It’s time to building your automation(s).
]]>- The abysmal Amazon FireStick App – namely the need to constantly switch off the ‘new’ player due to its inability to play certain content.
- The Docker containers insatiable appetite for memory, and its recent second course of /tmp storage to boot.
- Content, that I don’t want and isn’t young kid friendly, especially when I’m paying for the platform.
Couple the above with a couple of ‘epic’ failures in consuming synchronized content offline (imagine a 3 year old, getting onto an 11 hour flight unable to access *anything*)… it’s safe to say I was ready to move on to pastures new.
I’d come across Jellyfin 12+ months back, but has dismissed it because there was no FireStick App, and with a young family ease of use is a must. Well… all that changed at some point in the last year as there is now an ‘approved’ FireStick app. After a couple of months of use, I’m pleased to have made the move, experiencing only a couple of minor niggles.
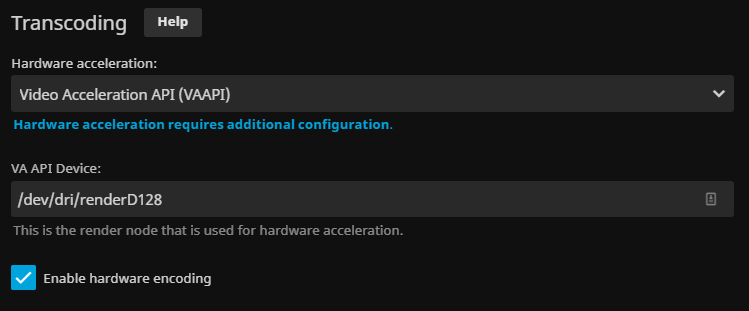
I opted to deploy Jellyfin using Docker, so the steps below assume you are already running Docker CE on your host/ media server. I also chose to enable Hardware Accelerated Encoding, using VAAPI.
First, create required directories, note, you may want to adjust for your environment.
mkdir -p ~/jellyfin/config
mkdir -p ~/jellyfin/cache
mkdir -p ~/jellyfin/transcode

sudo chown -R 1000:44 ~/jellyfin/
Now create the docker-compose.yml:
vi ~/jellyfin/docker-compose.ymlPaste contents as below, ensure you update volumes to reflect locations of your media:
version: '3.2'
services:

  prometheus:
    user: 1000:44
    image: jellyfin/jellyfin
    container_name: jellyfin
    network_mode: "host"
    logging:
      options:
        max-size: "10m"
        max-file: "5"
    restart: unless-stopped

    volumes:
    - /mnt/media:/media:shared:ro

    devices:
      # VAAPI Devices
      - /dev/dri/renderD128:/dev/dri/renderD128
      - /dev/dri/card0:/dev/dri/card0
Note that user 1000:44 enables access to the VAAPI devices required for Hardware Accelerated Encoding.
You can now bring-up your Jellyfin environment:
sudo docker-compose up -dFinally, browse to http://<server-name/IP>:8096 to access your Jellyfin instance.
You can enable Hardware Acceleration by browsing to Dashboard | Playback (tested on Intel QuickSync-enabled CPU):
Note this guide assumes you have Docker CE running on the machine you intend to deploy and run Prometheus.
First, create the required user accounts:
sudo useradd -rs /bin/false prometheus
sudo useradd -rs /bin/false node_exporter
Make a note of the ‘prometheus’ account user and group id’s from /etc/passwd, you’ll need these later:
cat /etc/passwd | grep prometheusCreate the required directory structure, in order to ensure configuration and metric data persists container redeployment:
mkdir -p ~/prometheus/config
mkdir -p ~/prometheus/data
Create Prometheus configuration file:
sudo vi ~/prometheus/config/prometheus.ymlContents (note that ‘localhost’ is used for targets):
# A scrape configuration scraping a Node Exporter and the Prometheus server
# itself.
global:
  scrape_interval:     15s # By default, scrape targets every 15 seconds.

scrape_configs:
  # Scrape Prometheus itself every 5 seconds.
  - job_name: 'prometheus'
    scrape_interval: 5s
    static_configs:
      - targets:
        - 'localhost:9090'

  - job_name: 'node'
    scrape_interval: 5s
    static_configs:
      - targets:
        - 'localhost:9100'

  - job_name: 'cadvisor'
    scrape_interval: 5s
    static_configs:
      - targets:
        - 'localhost:9080'
Set required filesystem permissions:
sudo chown -R prometheus:prometheus ~/prometheus/Create docker-compose.yaml:
vi ~/prometheus/docker-compose.yamlContents as below, remember to set the correct user id and group id for the ‘prometheus’ user , as captured earlier:
version: '3.2'
services:

  prometheus:
    user: 999:998
    image: prom/prometheus:latest
    container_name: prometheus
    logging:
      options:
        max-size: "10m"
        max-file: "5"
    restart: unless-stopped
    ports:
    - 9090:9090
    command:
    - --config.file=/etc/prometheus/prometheus.yml
    - --storage.tsdb.path="/data/prometheus"
    volumes:
    - ./config/prometheus.yml:/etc/prometheus/prometheus.yml:ro
    - ./data:/data/prometheus:rw
    depends_on:
    - cadvisor

  cadvisor:
    image: google/cadvisor:latest
    container_name: cadvisor
    logging:
      options:
        max-size: "10m"
        max-file: "5"
    restart: unless-stopped
    ports:
    - 8080:8080
    volumes:
    - /:/rootfs:ro
    - /var/run:/var/run:rw
    - /sys:/sys:ro
    - /var/lib/docker/:/var/lib/docker:ro
    depends_on:
    - redis

  redis:
    image: redis:latest
    container_name: redis
    logging:
      options:
        max-size: "10m"
        max-file: "5"
    restart: unless-stopped
    ports:
    - 6379:6379
I ran into issues with the containerised version of node-exporter, where instances in Grafana would persistently show ‘N/A’ or no-data, despite metrics being captured as expected in Prometheus itself.
Moving to a ‘natively’ installed node-exporter fixed these issues.
Download and extract the latest version of node-exporter, this is an X66_64 example:
cd ~

wget https://github.com/prometheus/node_exporter/releases/download/v1.0.0/node_exporter-1.0.0.linux-amd64.tar.gz

tar -xvf node_exporter-1.0.0.linux-amd64.tar.gz
cd node_exporter-1.0.0.linux-amd64
Copy the node-exporter binary to /usr/sbin:
sudo mv node_exporter /usr/sbin/Create systemd service:
sudo touch /etc/systemd/system/node_exporter.service

sudo tee -a /etc/systemd/system/node_exporter.service > /dev/null <<EOT
Description=Node Exporter

[Service]
User=node_exporter
EnvironmentFile=/etc/sysconfig/node_exporter
ExecStart=/usr/sbin/node_exporter $OPTIONS

[Install]
WantedBy=multi-user.target
EOT

sudo mkdir -p /etc/sysconfig
sudo touch /etc/sysconfig/node_exporter

sudo tee -a /etc/sysconfig/node_exporter > /dev/null <<EOT
OPTIONS="--collector.textfile.directory /var/lib/node_exporter/textfile_collector"
EOT
Create required folder structure for node-exporter, note the use of the ‘node_exporter’ account we created earlier:
sudo mkdir -p /var/lib/node_exporter/textfile_collector
sudo chown node_exporter:node_exporter /var/lib/node_exporter/textfile_collector
Reload systemd daemons and start node-exporter:
sudo systemctl daemon-reload

sudo systemctl enable node_exporter

sudo systemctl start node_exporter
You should now be able to view node-exporter metrics via: https://localhost:9100
Now, we can start Prometheus and cAdvisor, as defined in our Docker Compose file:
cd ~/prometheus
sudo docker-compose up -d
You should now be able to browse Promethus itself via: http://localhost:9090
Browse to http://localhost:9090/targets and ensure that cAdvisor, Node and Prometheus show as ‘1/1 up’ – assuming that they do, you have a working Promethus installation.
Adding new nodes to Node-Exporter is as simple as deploying Node-Exporter as above, on each required ‘target’ or node you wise to monitor, then editing the prometheus.yml file to include the new ‘target’ – for example:
...

  - job_name: 'node'
    scrape_interval: 5s
    static_configs:
      - targets:
        - 'localhost:9100'
        - 'newserver:9100'

...
Add additional targets to the ‘node’ job (rather than creating new jobs for each host) as this will make viewing the data in Grafana easier.
Once you have updated and saved the configuration file, restart Prometheus:
cd ~/prometheus
sudo docker-compose restart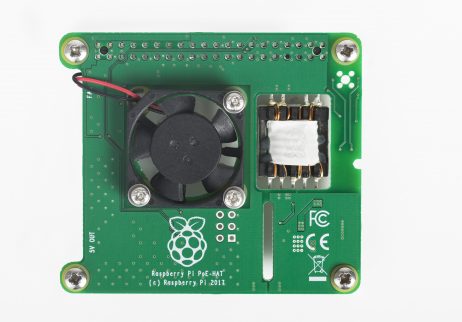
I was really excited (sad… I know) to get my Raspberry Pi PoE Hat in the post. My intention here was to de-clutter power cables and make my home automation setup more “wife friendly.”
Fitting the thing was surprisingly easy – ensure you attach the standoffs prior to fitting, you risk damaging the PoE hat each time you remove it. Once fitted I connected the network cable into my PoE switch and everything worked as expected – you’d expect it to be simple to be fair! Then came the noise!
If you’re looking to run this anywhere that noise could be an issue, don’t bother buying the PoE Hat. Even in the cool / early UK Spring I found the fan to run regularly and for extended periods. It’s a small fan so when it gets going it is noisy! Definitely not wife friendly… even less so than the cables!
I’d be interested to hear if your experiences are different!
]]>Updated June 2020 to allow NTP via iptables when VPN not established.
I recently setup a new SSID to enable quick and easy access to a VPN protected network when I needed it, also making this easily accessible for family members who are not computer-savvy.
I used a Raspberry Pi 3 for the task, as a router on a stick. This guide shares the configuration/ commands used to set this up so that:
- All traffic sent to the Raspberry Pi (from devices using it as their default gateway) will be routed via the VPN
- DNS requests sent to the Raspberry Pi (again, where clients are set to use it as DNS server) will be routed via the VPN
- When the VPN disconnects all traffic, including DNS is dropped until such time as the VPN reconnects
Network Topology
The network topology is fairly simple:
| VLAN Name | Subnet | Edge RouterX IP | Pi IP |
| Trusted | 192.168.1.0/24 | 192.168.1.254 | N/A |
| VPN | 172.16.1.0/24 | 172.16.1.254 | 172.16.1.1 |
Configuration
Assuming you have the latest Raspbian Lite image running and updated via apt-get update / apt-get dist-upgrade you’re good to go.Flash Raspbian Lite latest onto an SDCard
Install Log2RAM
If you’re using an SDCard it might not be a bad idea to use Log2Ram to protect it – simply put this reserves ~40MB of RAM and logs directly to this, rather than the write-sensitive SDCard. Every hour logs are rotated/ zipped and dropped back onto the SDCard. The only downside is the potential to lose the last hour of logs on a hard reset/ power off.
curl -Lo log2ram.tar.gz https://github.com/azlux/log2ram/archive/master.tar.gz
tar xf log2ram.tar.gz
cd log2ram-master
chmod +x install.sh && sudo ./install.sh
cd ..
rm -r log2ram-master
Disable IPv6
Most VPN service providers don’t offer a robust IPv6 service thus this represents a potential leak/ weakness in your setup.
echo "# Disable ipv6" | sudo tee -a /etc/sysctl.conf
echo "net.ipv6.conf.all.disable_ipv6 = 1" | sudo tee -a /etc/sysctl.conf
echo "net.ipv6.conf.default.disable_ipv6 = 1" | sudo tee -a /etc/sysctl.conf
echo "net.ipv6.conf.lo.disable_ipv6 = 1" | sudo tee -a /etc/sysctl.conf
sudo sysctl -p
Enable IPv4 Forwarding
echo -e '\n#Enable IP Routing\nnet.ipv4.ip_forward = 1' | sudo tee -a /etc/sysctl.conf
sudo sysctl -p
Set Static IP
Ensure you update the code below with the relevant IP address/ subnet mask, gateway and DNS servers for your network/ VPN provider:
# Replace x.x.x.x and y.y.y.y with your VPN providers DNS server addresses
echo "interface eth0" | sudo tee -a /etc/dhcpcd.conf
echo "static ip_address=172.16.1.1/24" | sudo tee -a /etc/dhcpcd.conf
echo "static routers=172.16.1.254" | sudo tee -a /etc/dhcpcd.conf
echo "static domain_name_servers=x.x.x.x y.y.y.y" | sudo tee -a /etc/dhcpcd.conf
Define Static Routes
Based on the example topology I want to be able to manage this device from the “trusted” network, I therefore need to create a static route back to this network, via the Edge Router X. Without this, when OpenVPN connects it will block connectivity to this network.
echo "ip route add 192.168.1.0/24 via 172.16.1.254 dev eth0" | sudo tee /lib/dhcpcd/dhcpcd-hooks/40-routesInstall OpenVPN
sudo apt-get install -y openvpnConfigure OpenVPN
This configuration will work with NordVPN, you may need to modify the script to accommodate a different VPN provider:
############ Create .secrets file
echo <username> | sudo tee -a /etc/openvpn/.secrets
echo <password> | sudo tee -a /etc/openvpn/.secrets
sudo chmod 600 /etc/openvpn/.secrets

############ Download Config File
sudo wget -O /etc/openvpn/openvpn.conf https://<path to opvenvpn config file>

############ Configure VPN Client
sudo sed -i "s|auth-user-pass|auth-user-pass .secrets|g" /etc/openvpn/openvpn.conf

sudo sed -i '/auth-user-pass .secrets/a \
script-security 2 \
up /etc/openvpn/update-resolv-conf \
down /etc/openvpn/update-resolv-conf' /etc/openvpn/openvpn.conf

sudo sed -i '/client/a \
redirect-gateway' /etc/openvpn/openvpn.conf

sudo sed -i 's/#AUTOSTART="all"/ AUTOSTART="all"/g' /etc/default/openvpn

############ Enable Service and Connect to VPN
sudo systemctl daemon-reload
sudo systemctl restart openvpn
sudo systemctl enable openvpn
Install DNS Masq
##### Install/ Configure DNS Masq to prevent DNS Leaks
# Replace x.x.x.x and y.y.y.y with your VPN providers DNS server addresses
sudo apt-get install dnsmasq
sudo sed -i "s|#interface=|interface=eth0|g" /etc/dnsmasq.conf
echo "server=x.x.x.x" | sudo tee -a /etc/dnsmasq.conf
echo "server=y.y.y.y" | sudo tee -a /etc/dnsmasq.conf
sudo systemctl daemon-reload
sudo systemctl enable dnsmasq
sudo systemctl restart dnsmasq
Firewall Configuration
Replace x.x.x.x with the IP address of the OpenVPN server, stored in the config file and ensure you review the “trusted” network IP address range / delete the rule if this is not required.
sudo sysctl -p
sudo apt-get install iptables-persistent
sudo systemctl enable netfilter-persistent
########### Flush
sudo systemctl stop openvpn
sudo iptables -P INPUT ACCEPT
sudo iptables -F
sudo iptables -t nat -F
########### NAT
sudo iptables -t nat -A POSTROUTING -o tun0 -j MASQUERADE
########### INPUT
sudo iptables -A INPUT -m conntrack --ctstate RELATED,ESTABLISHED -j ACCEPT
sudo iptables -A INPUT -p udp --dport 53 -j ACCEPT
sudo iptables -A OUTPUT -p udp --dport 123 -j ACCEPT
sudo iptables -A INPUT -s 192.168.1.0/24 -p tcp --dport 22 -j ACCEPT
sudo iptables -P INPUT DROP
########### FORWARD
sudo iptables -A FORWARD -i tun0 -o eth0 -m state --state RELATED,ESTABLISHED -j ACCEPT
sudo iptables -A FORWARD -i eth0 -o tun0 -j ACCEPT
sudo iptables -P FORWARD DROP
########### OUTPUT
# Replace x.x.x.x with the IP address of the OpenVPN server, stored in the config file
sudo iptables -A OUTPUT -m conntrack --ctstate ESTABLISHED -j ACCEPT
sudo iptables -A OUTPUT -d x.x.x.x/32 -p udp -m udp --dport 1194 -m comment --comment "vpn-server" -j ACCEPT
sudo iptables -A OUTPUT -o tun0 -m comment --comment "vpn" -j ACCEPT
sudo iptables -A OUTPUT -o eth0 -j DROP
########### Save
sudo iptables -t nat -A PREROUTING -i eth0 -p tcp -m tcp --dport 53 -j DNAT --to-destination 127.0.0.1
sudo netfilter-persistent save
Testing
You can test the configuration on the VPN server itself using the command below, this should return the IP address of your VPN server:
curl ipecho.net/plain; echoYou can also speed test this configuration using speedtest-cli:
sudo apt-get install -y speedtest-cli
speedtest-cli
Now, either point your clients DNS and default gateway at the Raspberry Pi, or setup a new DHCP Scope to automatically do this.
Why Raspbian?
I tested this configuration with Alpine Linux (v3.9.2 arm7 – I couldn’t get armhf to boot and arm64 crashed/ generated kernel panic on add rules to iptables!) but got stuck in a requirements loop where:
- All traffic is routed across VPN interface, when VPN is down no traffic can route
- OpenVPN would fail to connect due to clock skew/ certificate verification failing based on future validity
- Chrony requires DNS (despite using IP addresses in the configuration) and thus fails to sync time, so system clock skew is huge on startup – this fails as OpenVPN connection is down
If I enabled DNS traffic to traverse eth0 (i.e. not over the VPN) Chrony would work, but this left the setup open to DNS leaks. I also tried an iptables rule to accept all traffic from the chrony uid, this also failed to resolve the issue – I could still see a series of uid 0 (root) owned DNS requests that were dropped.
Raspbian Lite installs locally (no overlay filesystem, so no clock issues) and is fully supported by Raspberry Pi foundation (so gets regular updates etc). Given the limited potential benefits/ gains for changing this to a.n.other operating system I decided that this will do/ is “good enough!”
]]>Part Selection
The final parts list is as below:
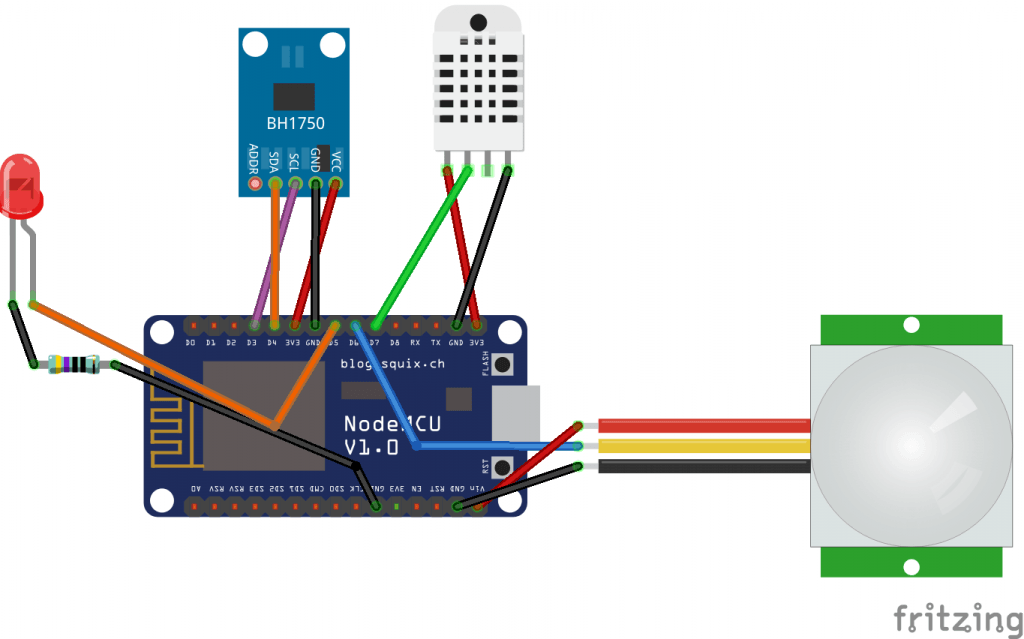
- BH1750 light sensor
- AM312 PIR sensor (anything else seemed to produce false triggers)
- NodeMCU v1 (Amica, not Lolin version)
- Red LED (used to show PIR triggered)
- 470 ohm resistor
- DHT22 Temperature/ Humidity Sensor
- Header wires
- USB Power Supply
- 3D Printed Case (I used 3D Hubs to print this)
I tested several sensors in arriving at the specification outlined above:
- RCWL-0516 (this was *far* too sensitive, would pickup movement in another room/ behind a wall/ door and even outside the house itself)
- TEMT6000 (poor low-light performance)
- LDR (poor low-light performance)
- Various PIR sensors (all of which generated false positives on a regular basis, likely wireless interference)
- NodeMCU Lolin boards (these will not fit in the case!)
The Case
Different electronics demanded a (slightly) different case, I also found the original case to be somewhat “cosy” – it was a real squeeze getting everything into the 3D printed case. I ended up iterating on Ben’s design, modifying it to be taller, with a cut out for the BH1750 to sit on top. You can see/ download the revised design at Thingiverse.
Software
My initial goal was to use the PIR as a trigger for a Node-RED-based automation that would switch the MQTT-enabled lights *OFF* in a room where there had been no movement for some time. The sensors, and modified code worked well for this purpose, however I started to run into issues as I expand the use of the devices, namely:
- When collecting data in InfluxDB, measurements would sometimes come through as zero, despite previous/ next being nothing close
- Occasional hanging/ freezing, requiring power reset
Tasmota to the rescue! I’ve been using Tasmota-powered MQTT/ Wifi light switches throughout my house for a while and it hadn’t dawned on my that I could use the same software in my multi-sensors.
Using the configuration below, with the device set to “Generic (18)” I was able to get like-for-like performance/ functionality (including the PIR triggering the red LED on motion) without the hanging/ zero-value measurement issues:
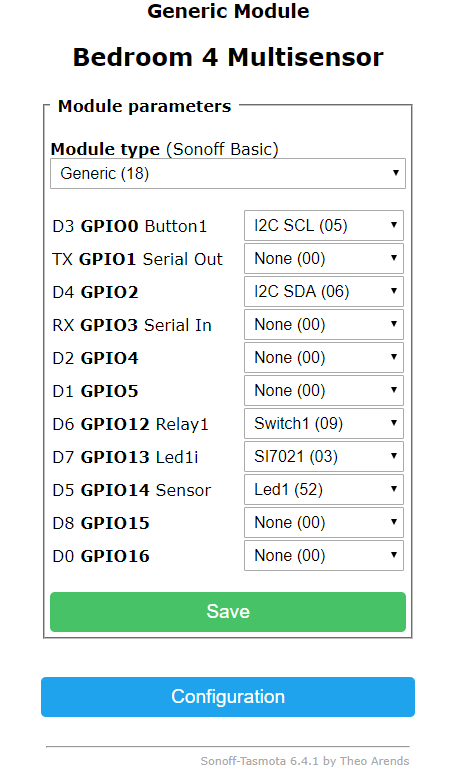
Wiring diagram below for reference:
Whilst the service is still “in development” the most significant updates for Q1 include:
- Google Home support added. You can now use the same devices across both smart home platforms (some device type restrictions apply).
- Service branding/ name changed to “Node-RED Smart Home Control.” URLs and service endpoints updated to reflect multi-platform nature of the service.
- Device state is retrievable in the Alexa and Google Home App, both Apps reflect real-time state changes fro either platform.
- You can now send “out-of-band” state updates to the service (i.e. from an MQTT subscription node). Changes sent will then update state in Alexa and Google Home app.
- New device types and capabilities added. You can find a full break-down in the GitHub Wiki.
If you’d like access to the service, in order to help with testing, or to simply try it out, follow these instructions.
]]>My Setup
- TP-Link EAP225 version 3 (2.4.0 Build 20181121 Rel. 55897)
- TP-Link TL-SG108PE version 2 (1.0.0 Build 20181120 Rel.40990)
- Ubiquiti Edge Router X (EdgeOS v1.10.8)
Additional Context
- Cost was a key factor in selecting hardware. Had the budget been bigger I’d have likely gone US-8-60W and UniFi Nano HD!
- I use VLANs for network segmentation/ isolation (for IOT devices, Guest, etc.) across both wired and wireless clients.
- I *was* using VLAN1 for the management interfaces and a trusted PC (I know… be gentle, it’s a home network). As part of troubleshooting this issue I moved the management VLAN to a different VLAN ID.
- I have multiple SSIDs on the EAP, all set to specific VLANs in order to benefit from wireless device network segregation.
- I use a Zone Based Firewall configuration on the Edge Router. This seems to be the easiest mechanism to enable network segmentation when using IPv6 addresses assigned via prefix delegation.
- All VLANs have IPv6 prefix-delegation configuration in-place, configuration in line with this guide
- Whilst I have a single AP at present, there will be three in this setup
The Problem
- After configuring IPv6 on the Edge Router I ran into an issue with additional IPv6 addresses being assigned to devices that were associated with a different network segment/ VLAN. A device would first receive a correct IPv6 address, with the relevant prefix assigned to the VLAN, but then a rogue address would appear, using a prefix associated with a different VLAN – specifically the management VLAN.
- This would actually break IPv6 connectivity on the devices as they would be unable to use the new router associated with the rogue IPv6 address.
Troubleshooting
- Initially I thought I’d missed something in the configuration (i.e. I’d fat-fingered something). Every VLAN interface on the EdgeRouter has a defined IPv6 prefix ID, as below. I checked each of these, over and over and over.
set interfaces ethernet eth0 dhcpv6-pd pd 0 interface switch0.50 host-address ':1'
set interfaces ethernet eth0 dhcpv6-pd pd 0 interface switch0.50 prefix-id '::5'
set interfaces ethernet eth0 dhcpv6-pd pd 0 interface switch0.50 service slaac
- I then looked to see if I could find anyone else with the same/ similar issues. It didn’t take long to find someone else with the same problem, albeit with slightly different TP-Link devices.
- Initially (from thread linked above) I thought this was down to the TL-SG108PE switch I had the EAP connected to. I’d read this device also leaks traffic from the default VLAN into other VLANs. However, after removing VLAN1 I was still getting an additional IPv6 address from the management VLAN prefix on wireless devices.
- Accepting the EAP may be affected by the same issue (as highlighted in linked thread above), I configured the management VLAN on the EAP and then assigned a dummy/ unused VLAN PVID (that has no IPv6 configuration) to the uplink port used by the EAP (with VLAN tagging set for required VLANs). At this point the rogue IPv6 address assignment issue was resolved.
Learnings
- Simply put the TP-Link EAP225 v3 (along with the TL-SG108PE ) “leaks” traffic from the default VLAN on to other VLANs. The IPv6 Router Advertisements (RAs) were leaking from the management / default VLAN to other VLANs. Whilst I was able to work around this specific issue, TP-Link’s engineers have now introduced a problem that’s broken wireless Client Isolation. Despite raising a support ticket, they seem thrilled with the new functionality (when enabled wireless devices cannot connect to wired devices on any VLAN, which borked all of my IOT/ MQTT connections).
- In an IPv4-only environment, my own experience in testing this device was really positive, albeit prior to the recently introduced wireless Client Isolation issue!
- TLDR, I’m returning the TP-Link EAP225 v3, swapping it out for an Ubiquiti UAP-AC-LITE… I guess you really do get what you pay for!
I’ve now got a bunch of these around the house, integrated with the Node Red Alexa Smart Skill v3 Bridge. Over the last three months these have proven to be very reliable (faultless actually) and very effective when paired with the custom multi-sensors I have built using ESP8266 NodeMCU boards to drive automation. I figured I would share my experience/ how I got them up and running.
Note that this guide assumes you have a secure MQTT server available for use, and Node-RED deployed should you want to take advantage of the Node Red Alexa Smart Skill v3 Bridge. If you’ve not got either of these in-place watch this space – further guides to follow.
Check your Wiring
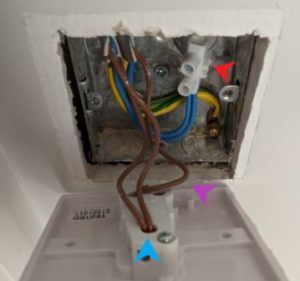
Always switch off the mains when removing face-plates or performing any work on your light switches.
Wiring standards in the UK are also a real issue for Smart Switches. I’m lucky enough to live in a new home (<5 years old at time of writing), meaning I have neutral (red arrow in image below) wires at the switch, along with common (light blue arrow) and switched live (purple arrow) plus earth. Wherever you are located, before you start down the path of smart light switches check your wiring! This may considerably limit your choices.
Flashing the T1 with Tasmota
Never try to open or connect your FTDI/ jumper cables to a Sonoff devices whilst it has mains power attached. You could be severely injured and/ or die.
I’ve flashed a number of these devices now, using the process outlined below every time. Before you proceed:
- Download Tasmota from GitHub and extract to a folder on your device – we need to change a couple of files before we flash the Sonoff T1.
- Download and Install Visual Studio Code and install the Platform IO extension.
Open the Device and Connect FTDI Adaptor
First, you’ll need to purchase an FTDI adaptor, I use a CP2102 device purchased from eBay (I have no affiliation with the seller, buy whichever FTDI adaptor you want!). Ensure that you install the driver(s) required for your FTDI adaptor before proceeding.
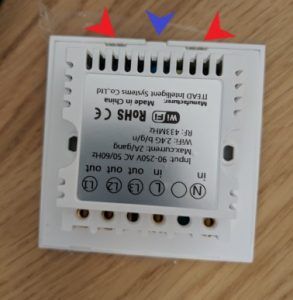
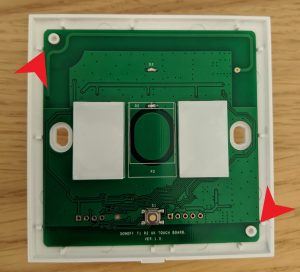
The Sonoff T1 is easy to get into, simply use a small flat-headed screwdriver to pry open where the red arrows indicate. Be careful not to slip as you can easily scratch the paint on the inside of the glass front.
You can remove the ESP board by simply getting your fingernail under one of the corners (red arrows) and applying a small amount of leverage.
Connect your FTDI adaptor as shown below (last pin is not used) – ensure your FTDI adaptor is not connected to your computer yet. Note you should only use 3.3v, not 5v, when connecting your FTDI adaptor, should you accidentally use 5v you’ll need to order another T1 device!
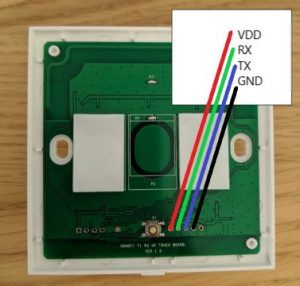
I found that I could simply wrap the jumper cables around the device in order to maintain a sufficiently good connection: no need to solder anything.
The hardware is all set to flash! Time to get our Tasmota customisations ready.
Prepare Tasmota User Config
I opt to pre-set all of the wireless, MQTT, web interface username and password via a user_config_override.h file. You can find the configuration I use on GitHub.
Copy the user_config_override.h file under the “sonoff” folder in your extracted Tasmota folder. You’ll also need to modify user_config.h to enable the use of the override file – find this line in modify user_config.h and uncomment:
//#define USE_CONFIG_OVERRIDE // Uncomment to use user_config_override.h file. See README.md
The final change required before we can flash Tasmota is to modify the platformio.ini file – specifically
- Find the [platformio] section near the top of the file and uncomment (remove the semi-colon) the line “env_default = sonoff” – ensure all other lines (firmware-varients) are commented.
- Next. find the [common] section and uncomment “platform = [email protected]” – ensure all other platforms are commented
- Finally, find the line that specifies upload_port and set to the correct COM port of your FTDI adaptor.
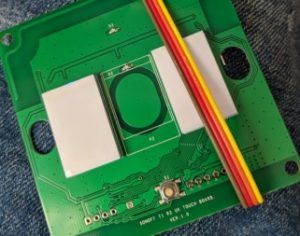
Boot your Sonoff T1 into Flash Mode
This is a little like a game of twister:
- plug-in your FTDI adapater whilst holding the Reset Button
- press and release Touch Pad 1 (only button on a one-gang model, or left-most button on a two/ three-gang).
The top LED will not be lit and BOTH touch pads will be very dimly lit.
Flashing Time!
Use the upload button at the bottom of the Visual Stuido Code/ Platform IO window to upload Tasmota to your Sonoff T1.

Once the process is completed check your router/ AP for the IP address given to the device. Browse to the device IP and login using the credentials you set in the user_config_override.h file. The final tasks here are:
- Set the module type, browse to Configuration | Configure Module | Set Type to “Sonoff T1 <# of Channels>” – the Sonoff T1 will reboot and will then show the correct power button options.
- Configure SetOpition13 to speed-up capacitive button response time. Browse to the console of the device and enter the command:
SetOption13 1
MQTT Integration, Node-RED and Home Assistant
More to follow on this, when I finish the posts on Mosquitto MQTT setup and Node-RED setup I’ll update this guide. For now, this post assumes you have both of these up and running, and that by configuring the MQTT device ID in the user_config_override.h file, you know how to integrate the Sonoff T1 into your environment.
Note, that if you are using Home Assistant, the supplied user_config_override.h file enables automatic discovery of the Sonoff T1 in your environment – enjoy!
Closing Thoughts
Pros
- The device itself looks sleek/ modern when fitted. Whether this is a good or bad thing will, of course, vary based on your decor.
- Quality-wise, I have nothing bad to say after three months use. Software-wise I’m not getting any random reboots/ commands that are ignored, but that said if I was it wouldn’t be down to the Sonoff T1 (I’m running custom firmware now remember!). Hardware wise, the Sonoff T1 seems well built – only time will tell here!
- The capabilities a smart switch offers. In terms of integration with Alexa, MQTT and the multi-sensors that trigger power events based on motion/ no motion and or light levels is, frankly, awesome. This definitely passes the wife test, and actually drove a faster adoption of the Sonoff T1 around the house.
Cons
- This isn’t a consumer-grade solution or product. Firmware flashing, Node-RED flows, MQTT deployment etc, it’s not going to be for everyone (or even most!). The Sonoff T1 has CE certification but for many this will not be enough for them to trust the device in their home. Will all of that said, you really don’t need to be a rocket scientist to get this stuff working!
- The capacitive buttons aren’t great – you have to be quite precise with your presses, and as there is nothing to “feel” this can be a pain. As we are using voice/ senor driven switching primarily this is not a huge problem for me.
- There is no Sonoff dimmer available (at time of writing). For now I am using one of these Tuya dimmers in the two rooms where I needed dimming. These units will also takes a slightly modified version of the the Tasmota firmware and thus integrates into Node-RED flows/ the Node Red Alexa Smart Skill v3 Bridge. I’ll be sharing a shorter version of this post on the device in the near future.